Configuration and Validation#
Config objects make styles reusable, while domain-specific exceptions and early validation make invalid inputs predictable. Complete class signatures, fields, and shorthand tables are available in API Reference.
Config Classes#
LinePlotConfig and its siblings ErrorPlotConfig, ErrorBandConfig, ScatterPlotConfig, and
HistogramConfig provide IDE autocomplete and can be reused across plots.
Any matplotlib parameter not covered by a named field can be forwarded through the _extra dictionary.
import matplotlib.pyplot as plt
import numpy as np
from plotez import plot_errorbar
from plotez.backend import ErrorPlotConfig
x = np.linspace(0, 10, 20)
y = np.sin(x)
y_err = 0.2
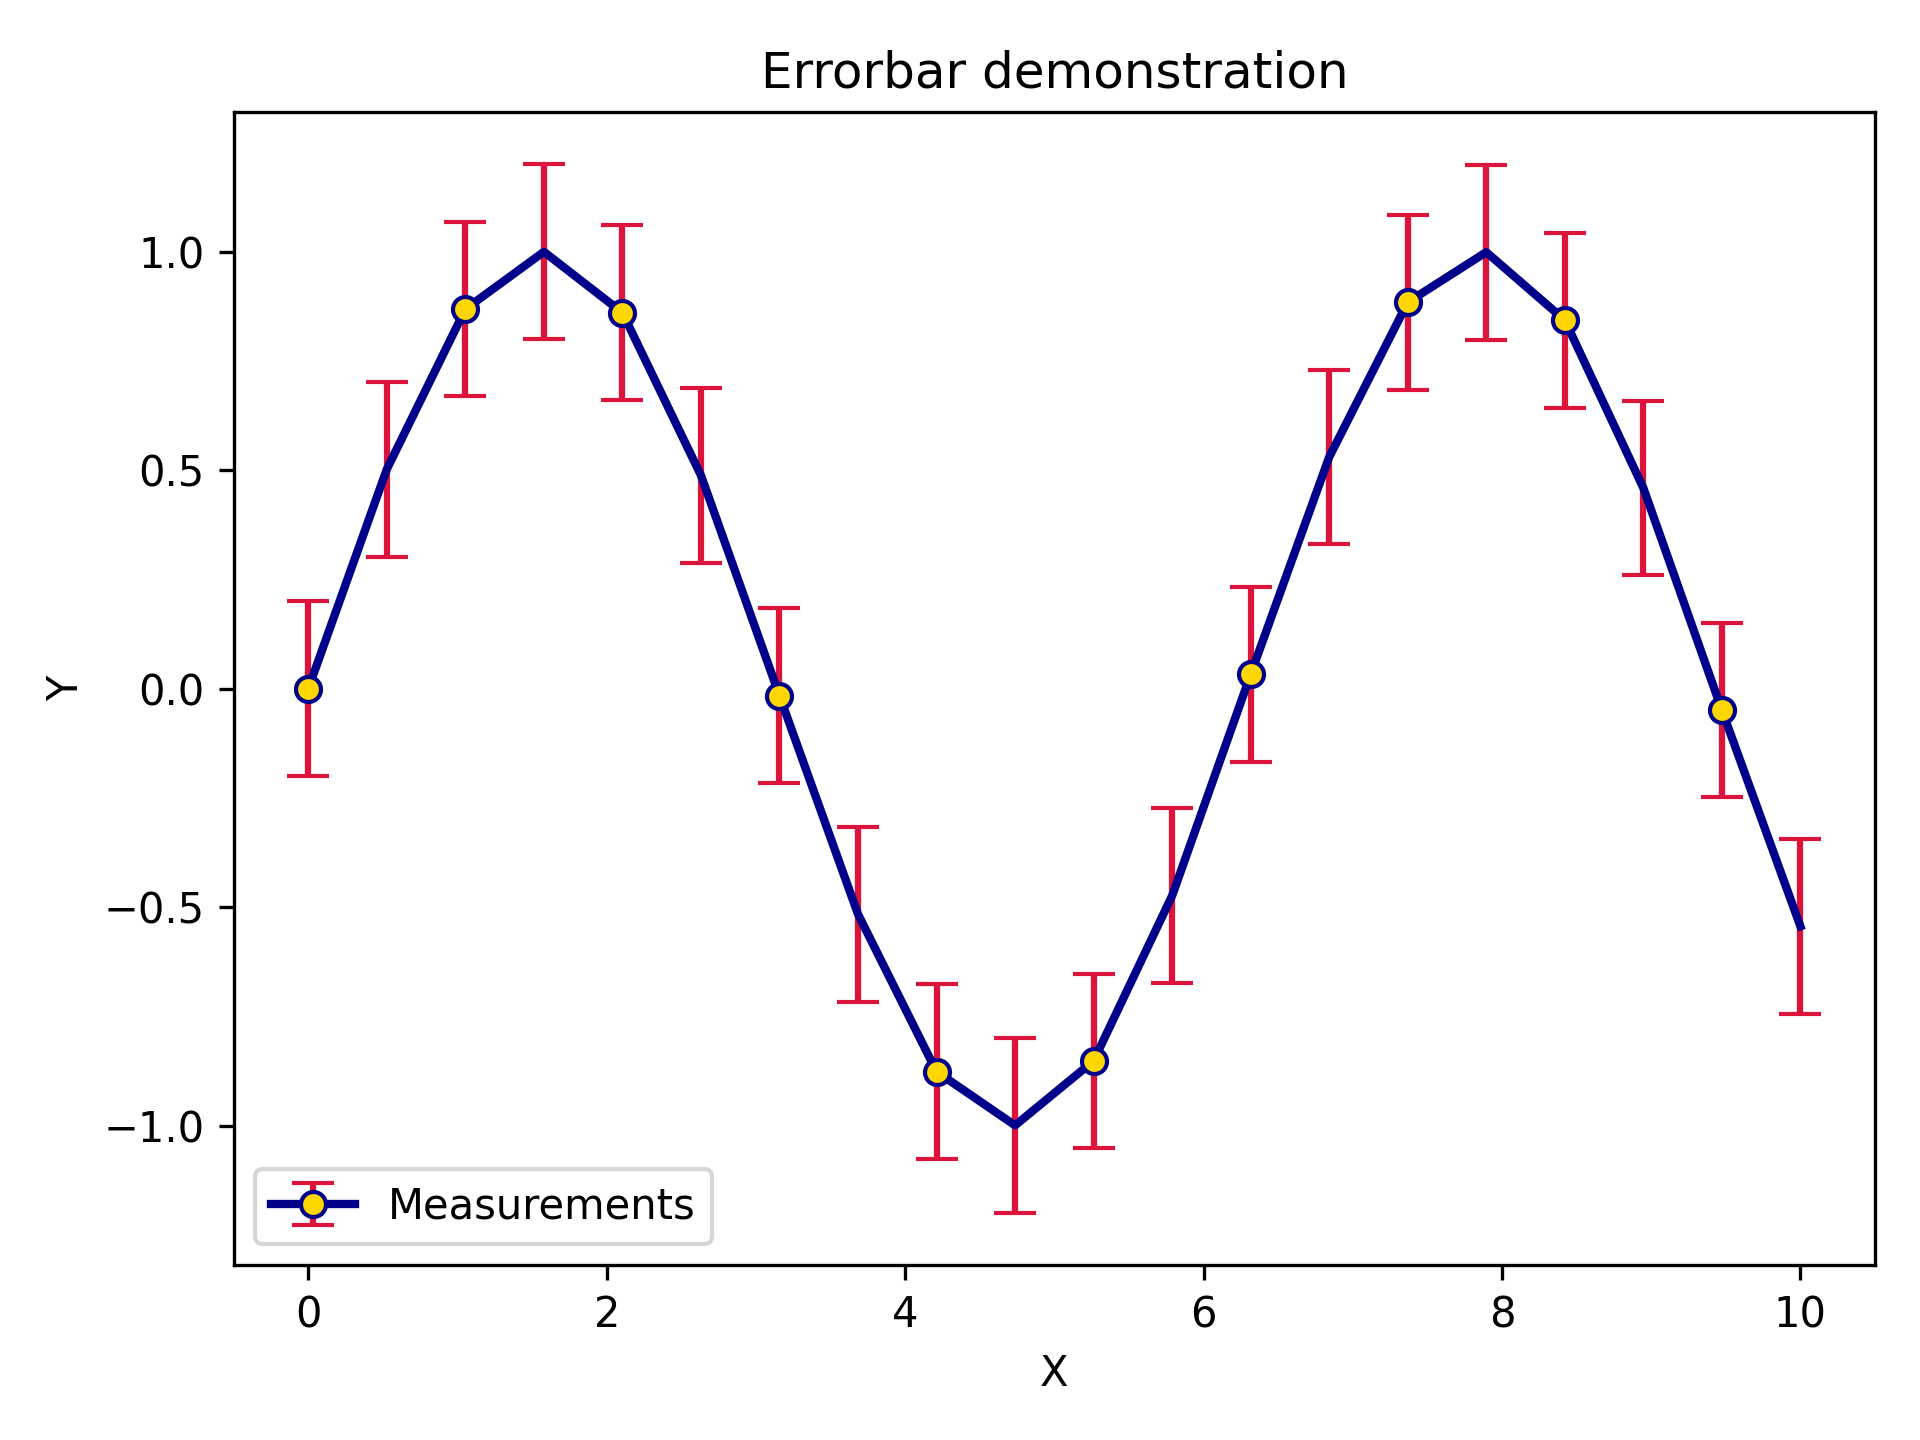
ep = ErrorPlotConfig(
color="darkblue", # Line and marker color
linewidth=2,
marker="o",
markersize=6,
capsize=5,
ecolor="crimson", # Error bar color (different!)
elinewidth=1.5,
markerfacecolor="gold",
_extra={"markevery": 2}, # The `_extra` keyword can take non-defined matplotlib keywords
)
plot_errorbar(
x_data=x,
y_data=y,
y_err=y_err,
x_label="X",
y_label="Y",
plot_title="Errorbar demonstration",
data_label="Measurements",
errorbar_config=ep,
)
Shorthand Helpers#
lpc, epc, ebc, spc, and hgc are factory functions that accept familiar matplotlib aliases such as
c, lw, ls, ms, mec, and mfc and return the corresponding config object.
from plotez import lpc, epc, ebc, spc, hgc

line = lpc(c='steelblue', lw=2, ls='--', marker='o', ms=4)
ep = epc(c='darkblue', ls=':', lw=2, marker='d', ms=6, capsize=8, elinewidth=2, ecolor='red')
band = ebc(c='cyan', alpha=0.3, ec='k', ls='--', hatch='/')
dots = spc(c='orange', s=40, alpha=0.7, marker='^')
hist = hgc(bins=40, c='steelblue', ec='white', alpha=0.8)
See the Shorthand Key Reference for every supported alias.
Exception Hierarchy#
PlotEZ provides domain-specific exceptions for clear, catchable error handling.
All public exceptions are available from plotez.errors.
PlotEZError
+-- OrientationError
+-- DataError
|   +-- ShapeError
|   +-- DataLengthError
|   +-- EmptyDataError
|   +-- ColumnCountError
+-- ConfigurationError
    +-- AxisLabelError
    +-- TwinXDataError
    +-- TwinYDataError
    +-- XArrayNot1D
    +-- YArrayNot1D
Catch a specific exception when recovery depends on the failure:
import numpy as np
from plotez import plot_errorbar
from plotez.errors import ShapeError

x = np.array([1, 2, 3])
y = np.array([1, 2, 3])
bad_err = np.array([[1, 2, 3], [4, 5, 6], [7, 8, 9]])

try:
    plot_errorbar(x, y, x_err=bad_err)
except ShapeError as error:
    print(f"Invalid error array: {error}")
Use DataError or ConfigurationError when one handler can cover a related group of failures.
The API Reference reference documents each exception.
Shape and Length Validation#
Public plotting functions validate inputs before calling matplotlib.
Data arrays that represent a single series must be one-dimensional, arrays that align must have equal lengths, and
asymmetric error arrays must have shape (2, N).
ShapeError reports invalid dimensionality or error-array shape.
DataLengthError separately reports arrays that do not align:
from plotez import plot_xy
from plotez.errors import DataLengthError

try:
    plot_xy([1, 2, 3], [10, 20])
except DataLengthError as error:
    print(f"Data does not align: {error}")
Grid functions also validate that the provided data fits the requested grid, and file plotting validates row and column counts before plotting.
Label Collections#
Label parameters such as data_labels, x_labels, y_labels, subplot_titles, and axis_labels accept
either a list[str] or tuple[str, ...]. Both forms behave the same, and PlotEZ copies the provided collection
before any internal normalization. Defaults remain None to avoid mutable default arguments.
from plotez import two_subplots

axs = two_subplots(
    x_list,
    y_list,
    x_labels=["Time (s)", "Time (s)"],
    y_labels=("Amplitude", "Phase"),
)