Error Visualization#
Use error bars for discrete measurements and shaded bands for dense, continuous data. Complete signatures and parameter details are available in API Reference.
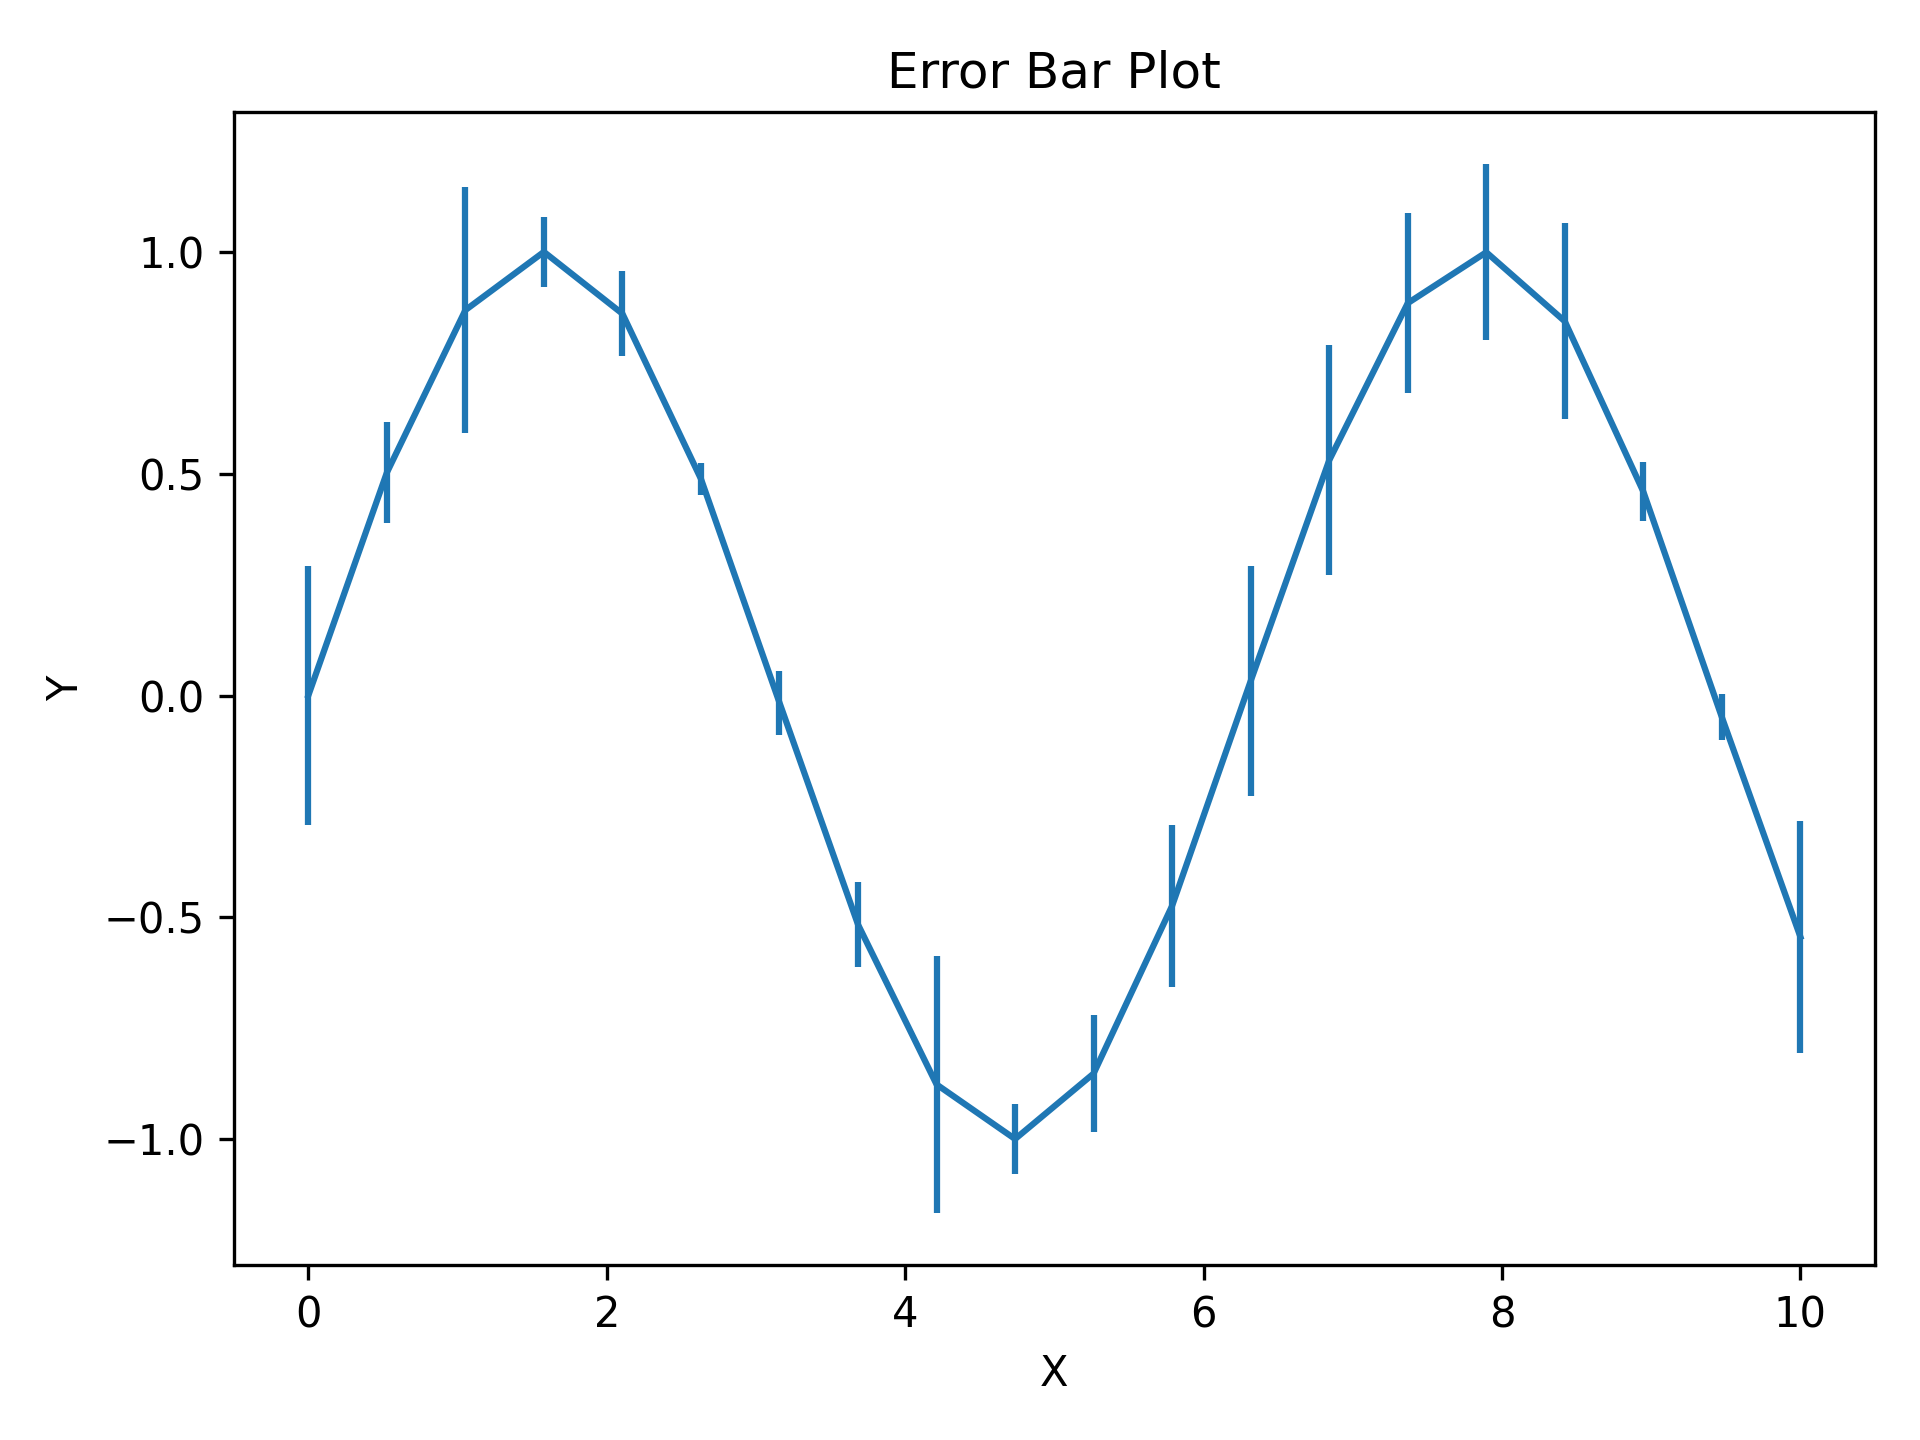
Basic Error Bars#
y_err (and x_err) can be a scalar (same error everywhere) or an array (per-point errors).
A 1D error array must match the corresponding data length; asymmetric errors must have shape (2, N).
Invalid shapes raise ShapeError and incompatible lengths raise DataLengthError before matplotlib is called.
Caps are shown by default and controlled via capsize.
import matplotlib.pyplot as plt
import numpy as np

from plotez import plot_errorbar

rng = np.random.default_rng(1234)

x = np.linspace(0, 10, 20)
y = np.sin(x)
y_err = 0.3 * rng.random(size=y.shape)

plot_errorbar(x, y, y_err=y_err)
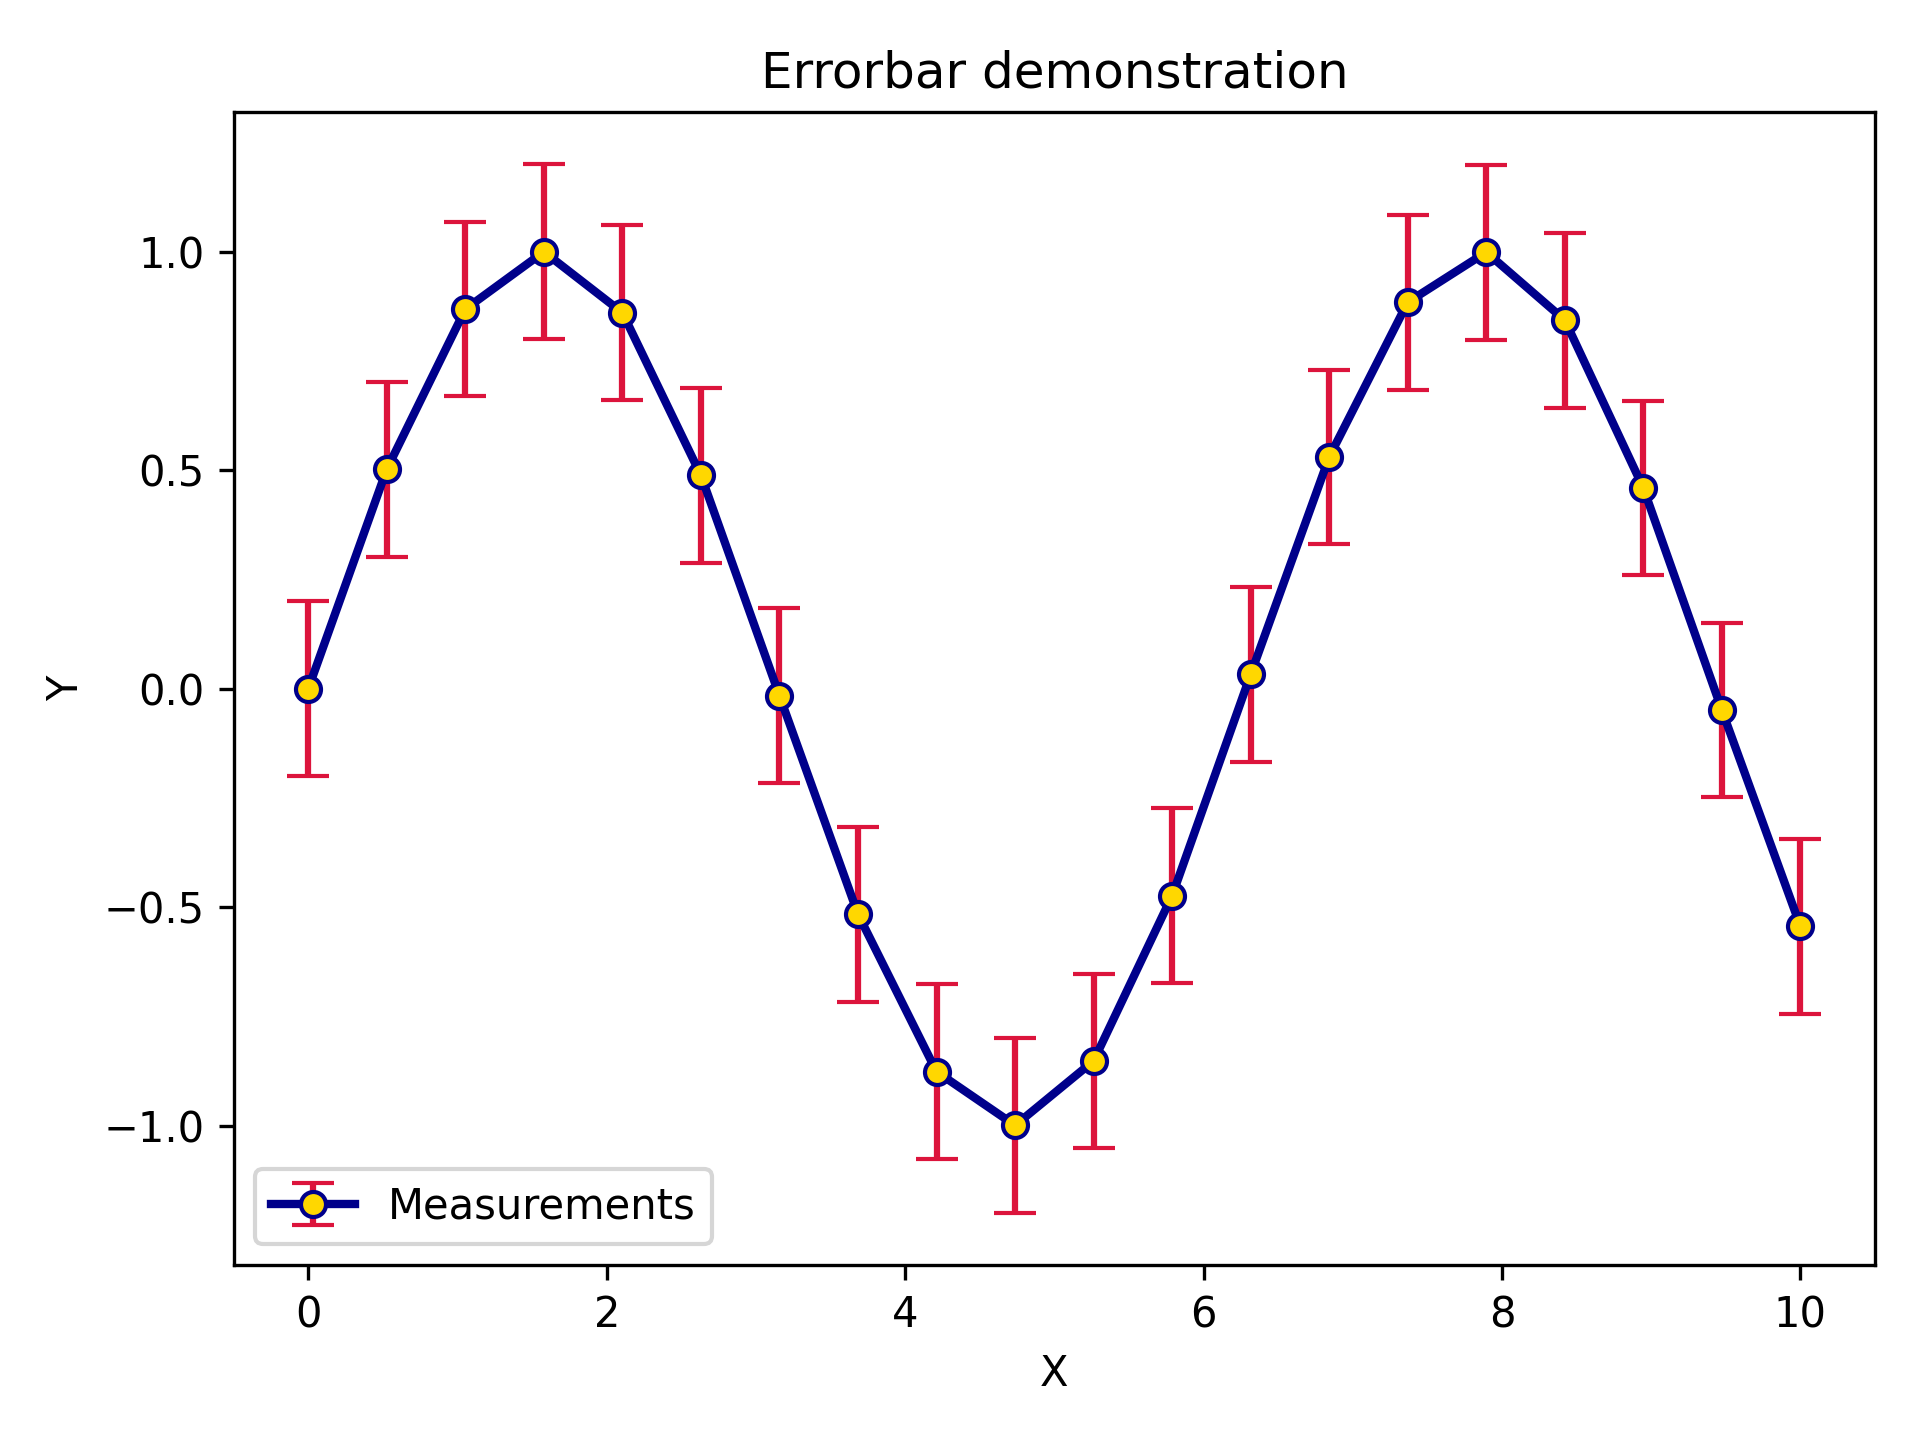
Styled Error Bars#
ErrorPlotConfig exposes line styling options plus specialized error bar parameters.
ecolor sets the error bar colour independently from the line colour; elinewidth sets the error bar line thickness.
import matplotlib.pyplot as plt
import numpy as np

from plotez import plot_errorbar
from plotez.backend import ErrorPlotConfig

x = np.linspace(0, 10, 20)
y = np.sin(x)
y_err = 0.2

ep = ErrorPlotConfig(
    color="darkblue",  # Line and marker color
    linewidth=2,
    marker="o",
    markersize=6,
    capsize=5,
    ecolor="crimson",  # Error bar color (different!)
    elinewidth=1.5,
    markerfacecolor="gold",
)
plot_errorbar(
    x_data=x,
    y_data=y,
    y_err=y_err,
    x_label="X",
    y_label="Y",
    plot_title="Errorbar demonstration",
    data_label="Measurements",
    errorbar_config=ep,
)
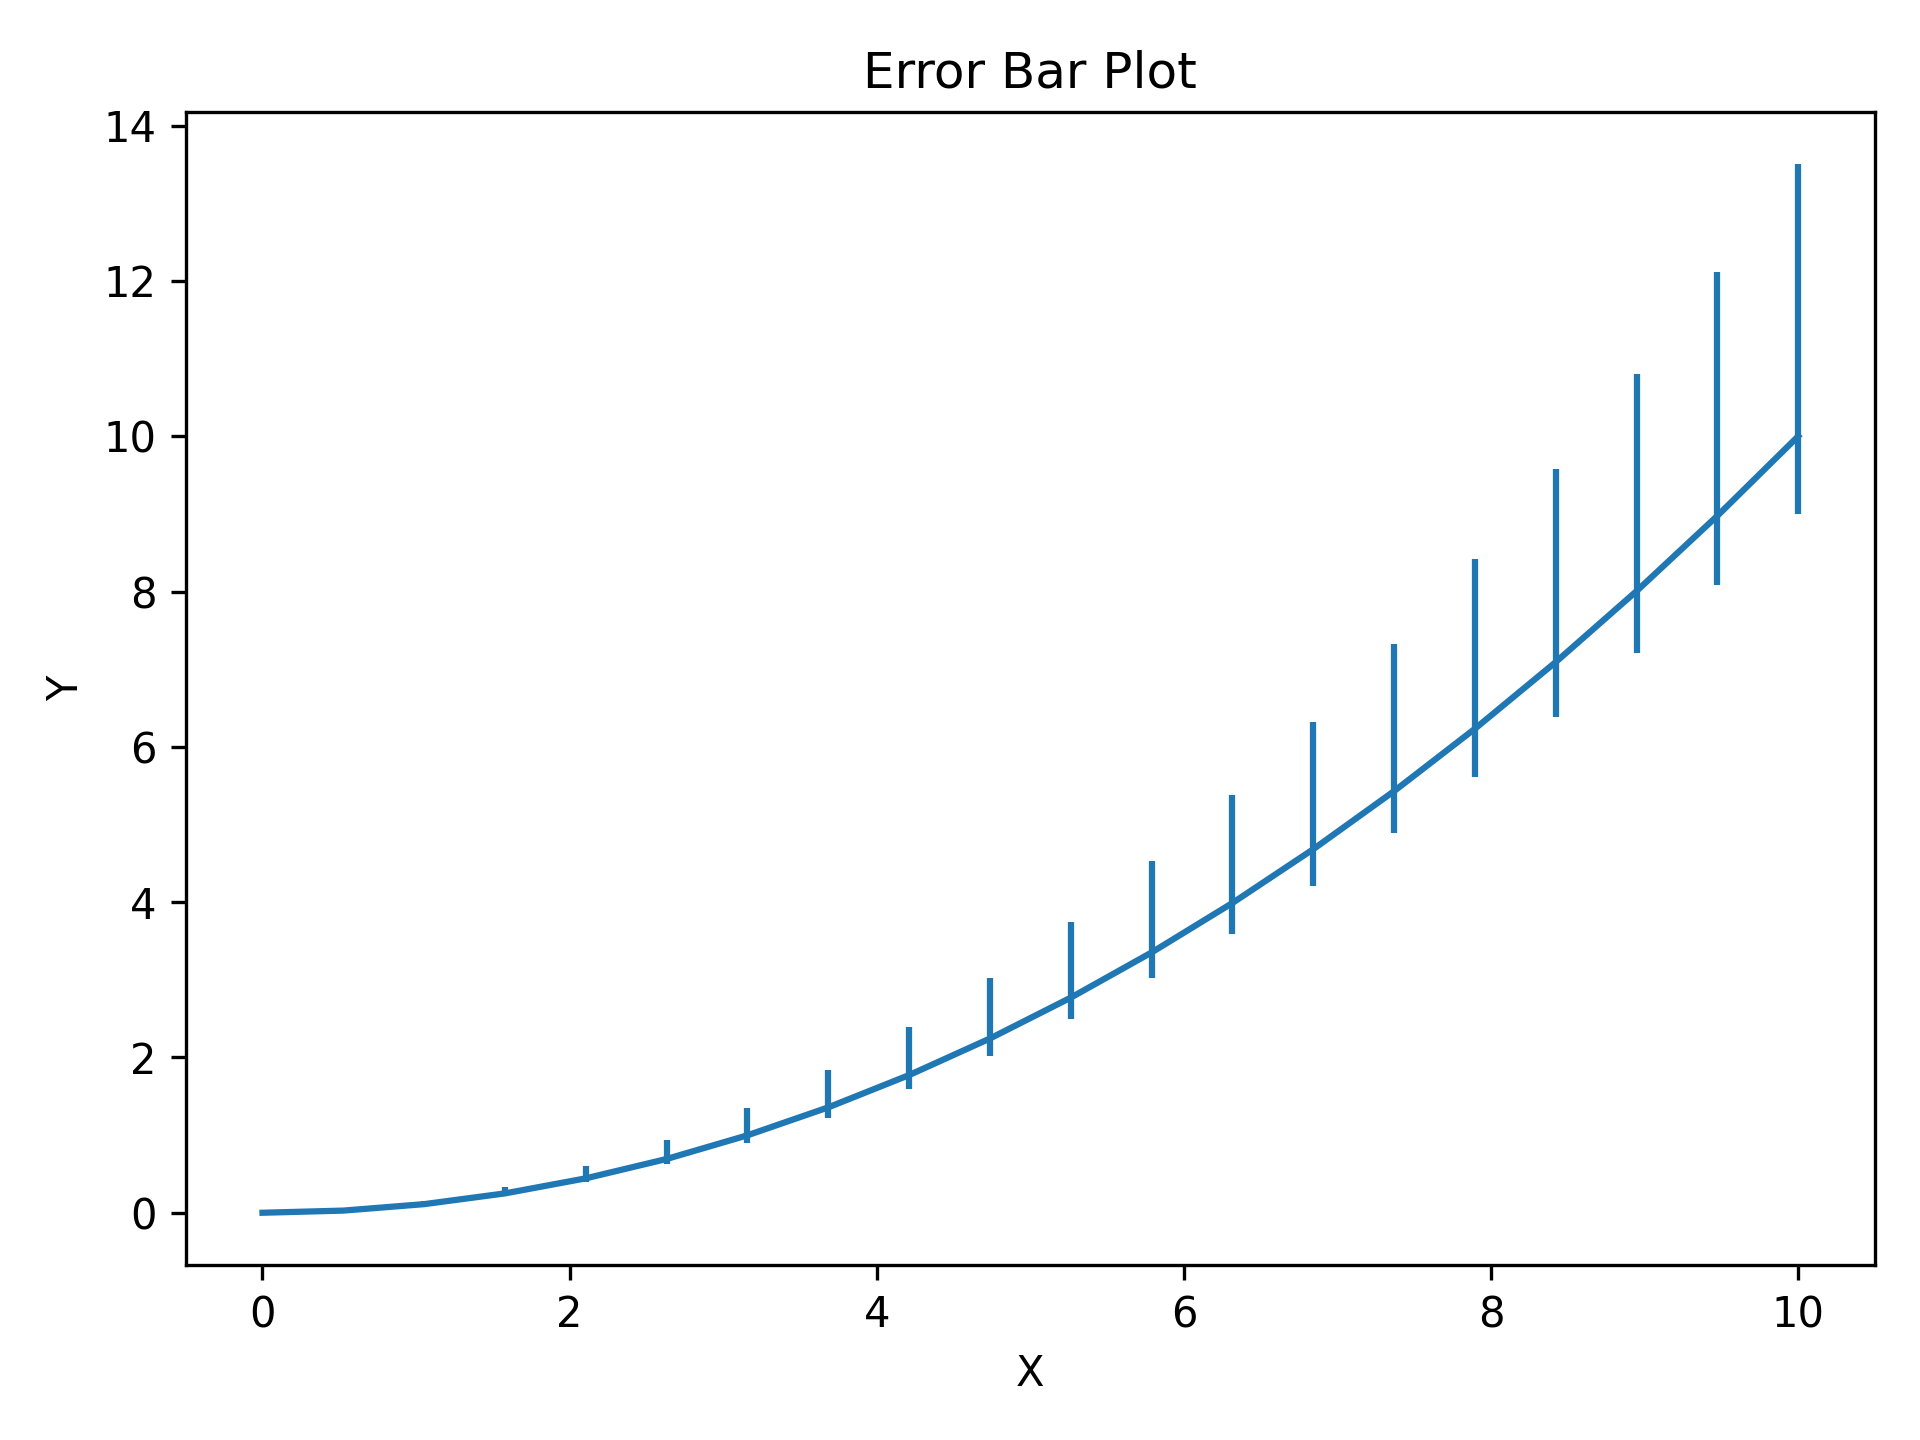
Asymmetric Errors#
Pass a (2, N) array to y_err (or x_err) for different lower and upper uncertainties: the first row contains
lower errors and the second contains upper errors.
import matplotlib.pyplot as plt
import numpy as np

from plotez import plot_errorbar

x = np.linspace(0, 10, 20)
y = x**2 / 10

# Shape (2, N): [lower_errors, upper_errors]
y_err = np.array([0.1 * y, 0.35 * y])  # Lower (10% of value)  # Upper  (35% of value)
plot_errorbar(x, y, y_err=y_err)
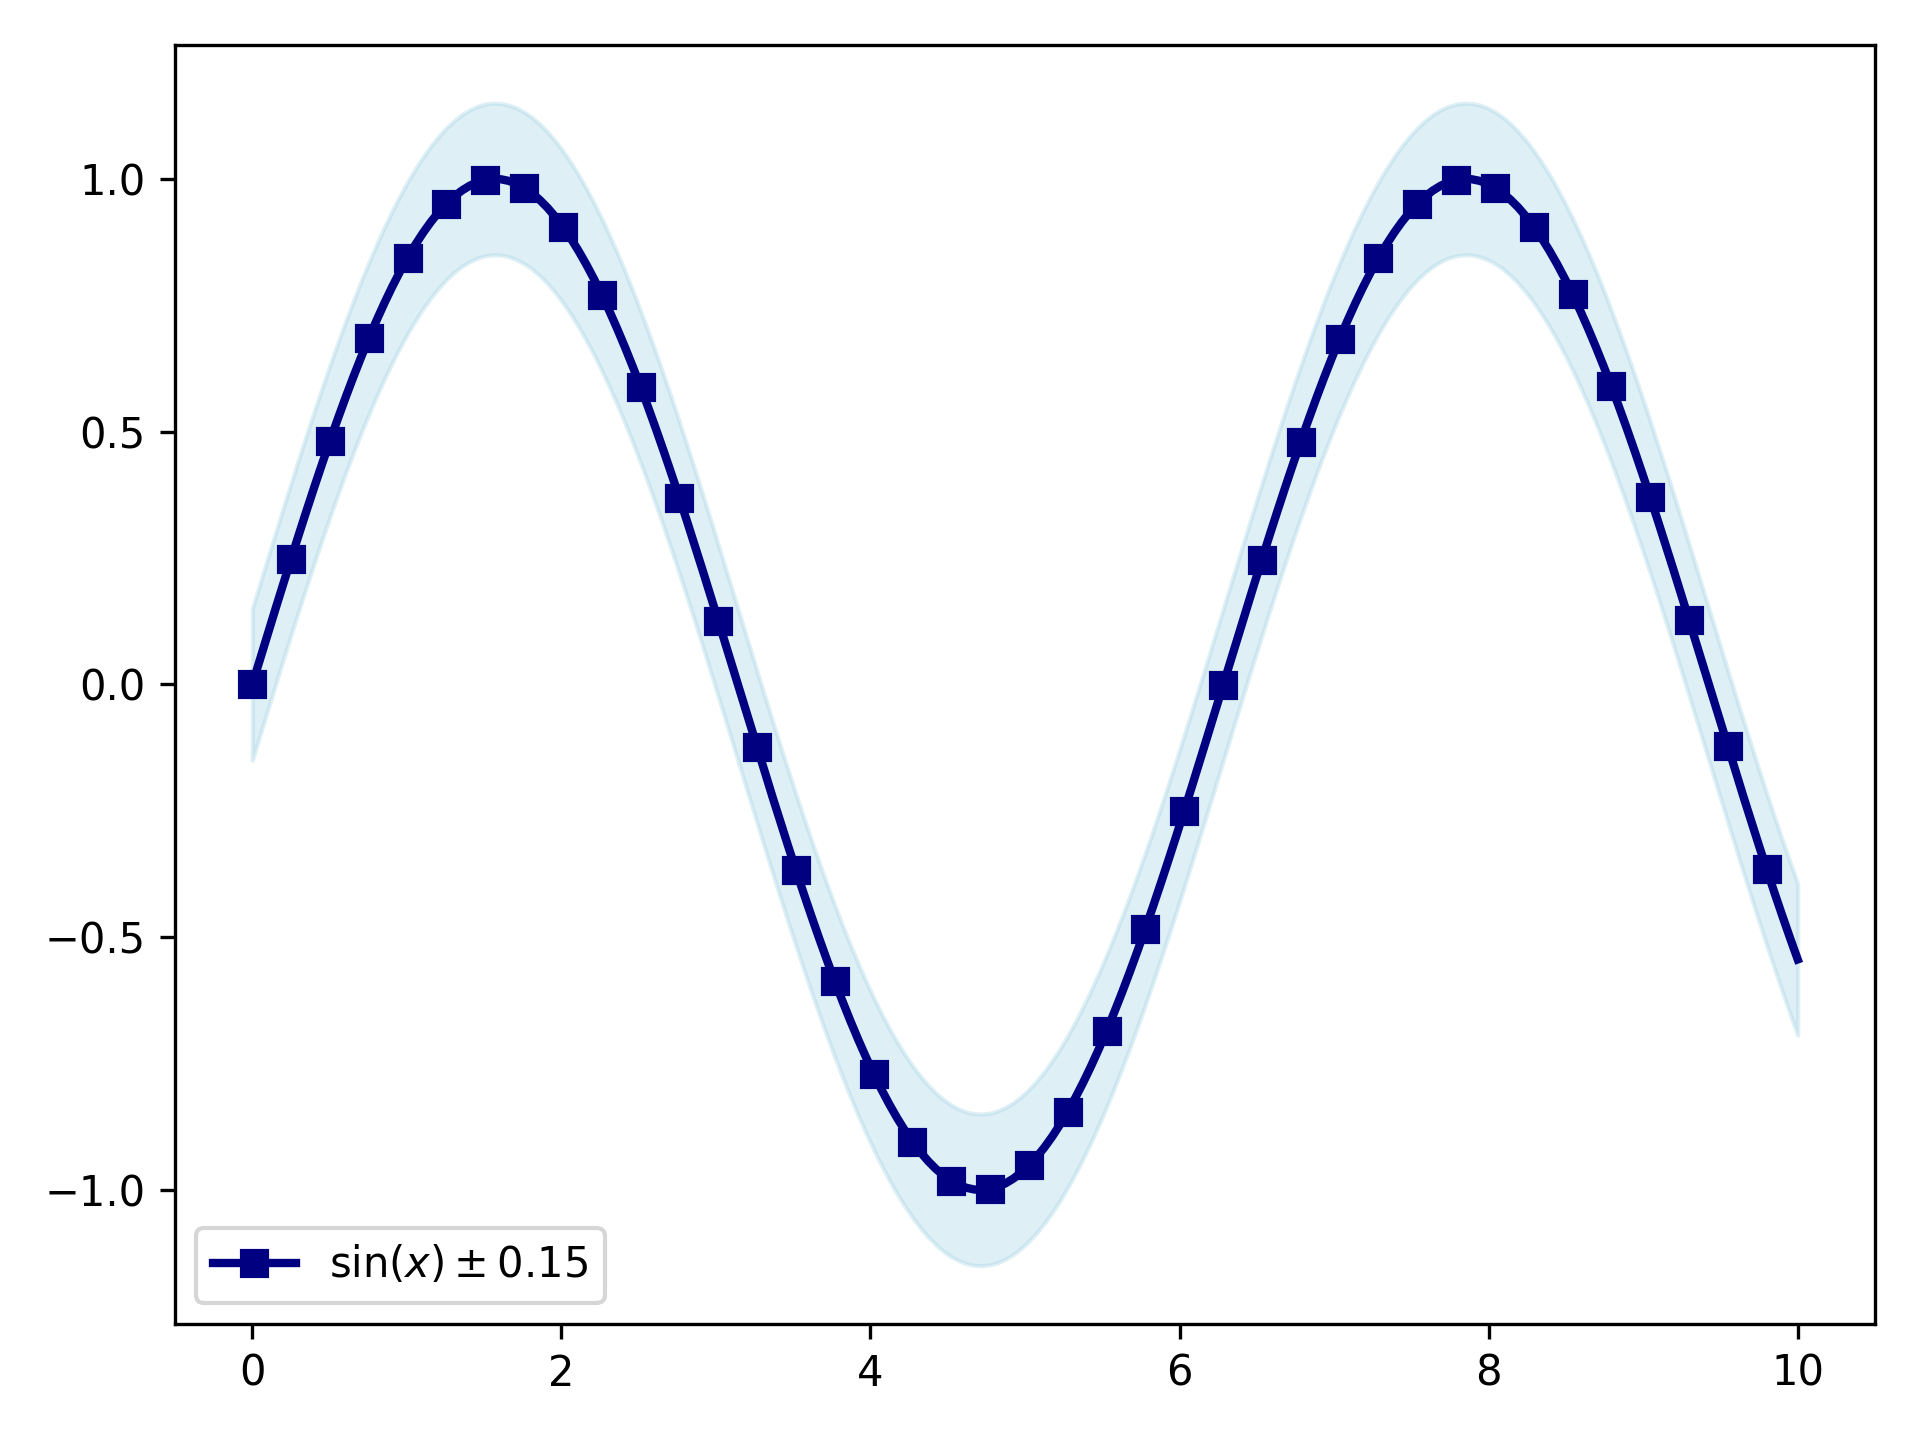
Absolute Error Bands#
For dense, continuous data shaded bands are cleaner than individual error bars.
y_lower and y_upper are absolute values (not offsets); band_config controls the fill and line_config
controls the central line.
Array-valued bounds must be 1D and have the same length as x_data and y_data.
import matplotlib.pyplot as plt
import numpy as np

from plotez import plot_errorband
from plotez.backend import ErrorBandConfig, LinePlotConfig

x = np.linspace(0, 10, 200)  # Dense sampling
y = np.sin(x)
y_lower = y - 0.15
y_upper = y + 0.15

band_cfg = ErrorBandConfig(color="lightblue", alpha=0.4)
line_cfg = LinePlotConfig(color="navy", linewidth=2, marker="s", _extra={"markevery": 5})

plot_errorband(
    x_data=x,
    y_data=y,
    y_lower=y_lower,
    y_upper=y_upper,
    data_label=r"$\sin(x) \pm 0.15$",
    band_config=band_cfg,
    line_config=line_cfg,
)
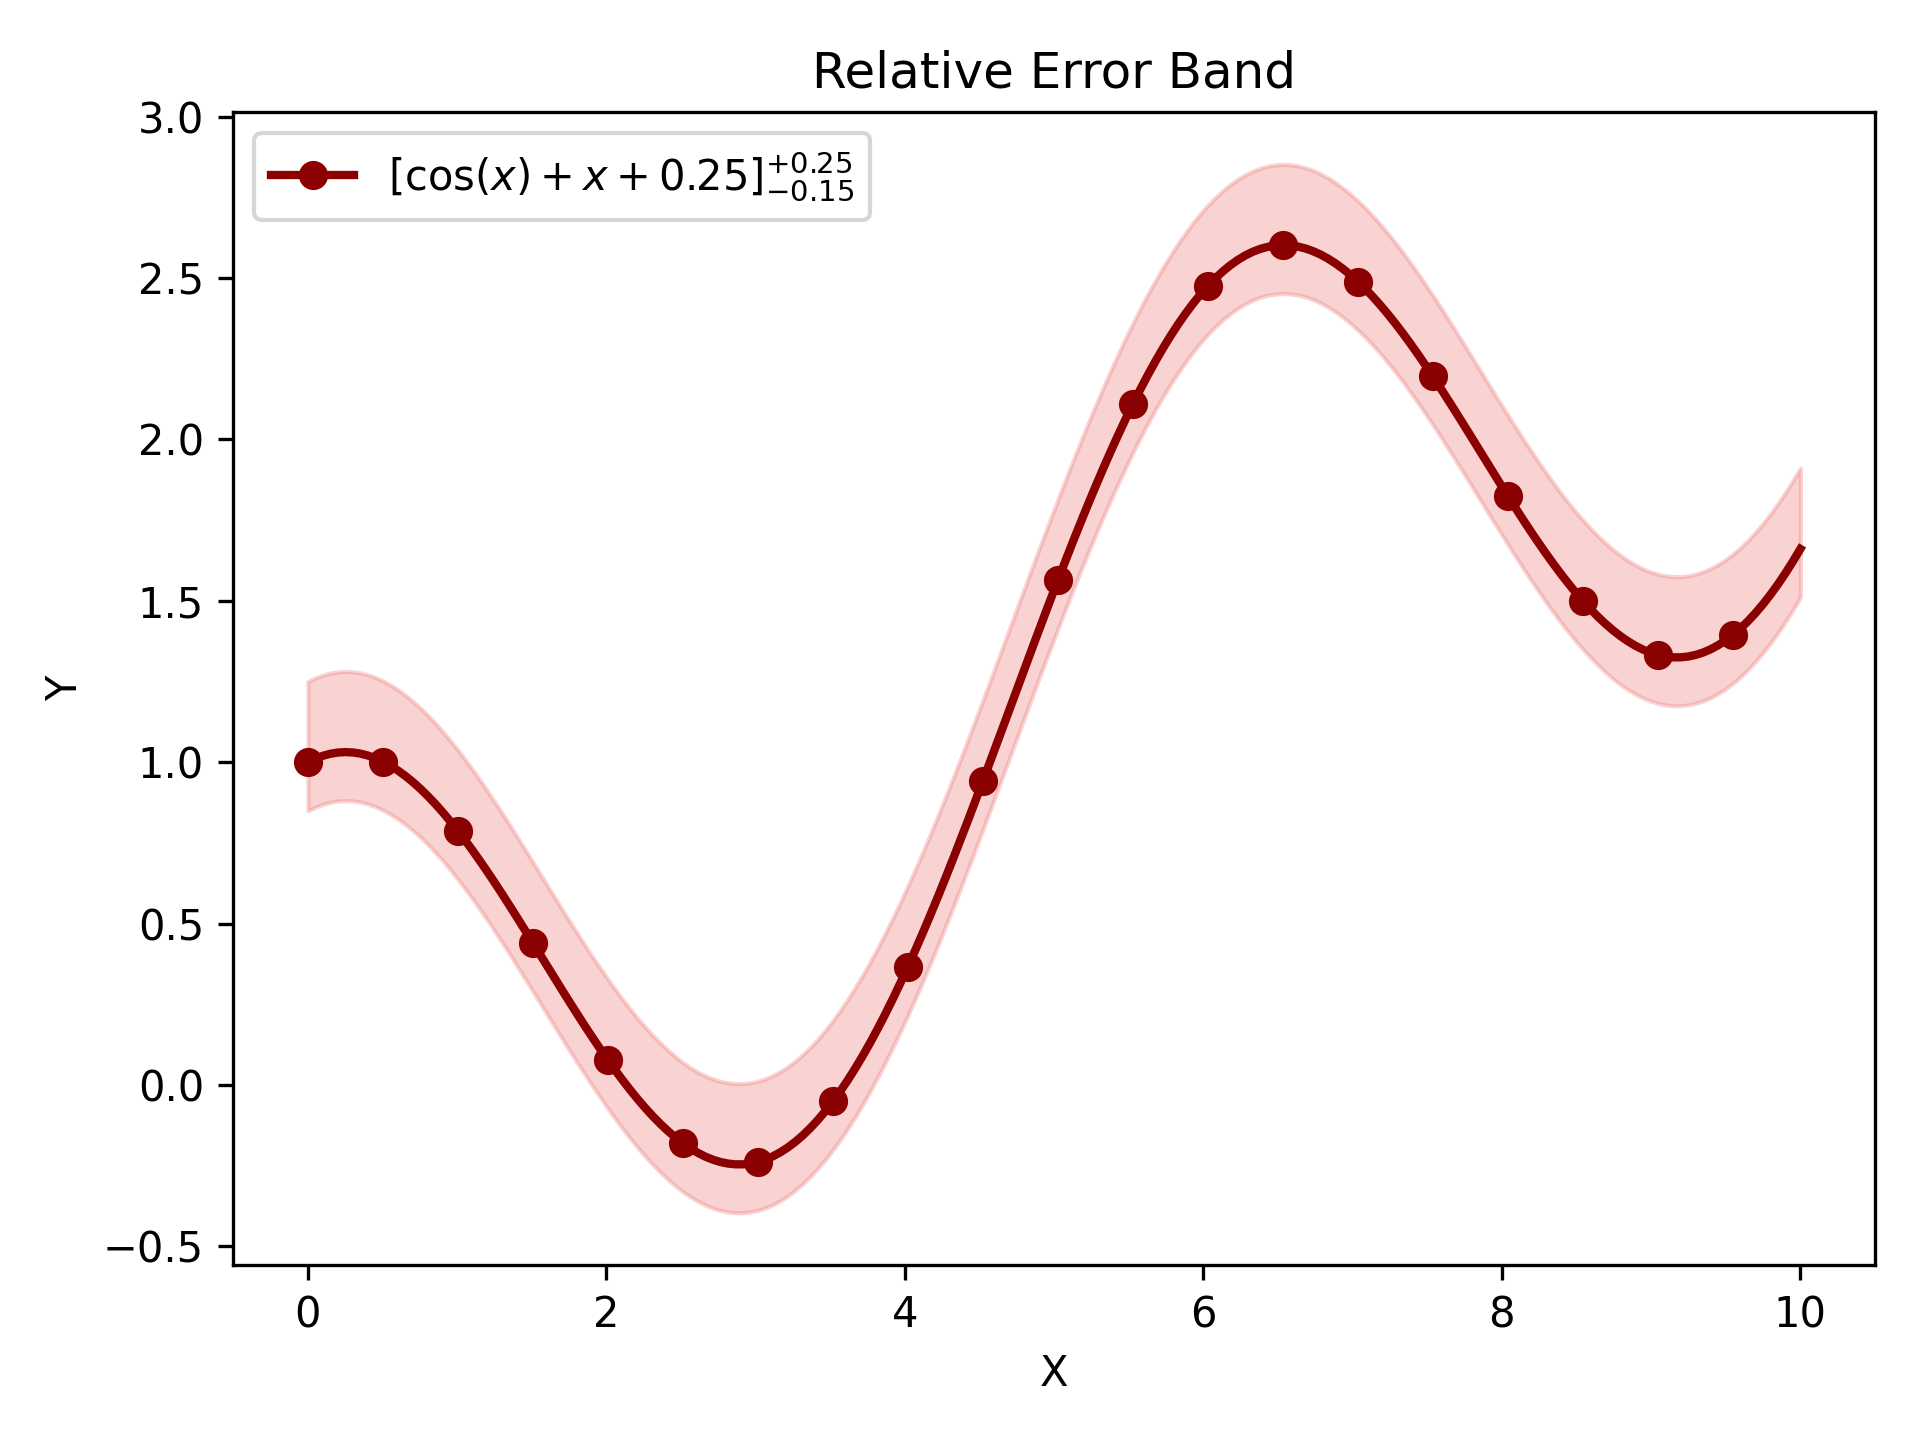
Relative Error Bands#
plot_errorband_relative is a convenience wrapper around plot_errorband where y_lower and y_upper are
offsets from y_data rather than absolute bounds.
You can pass a single uncertainty value and let plotEZ compute the band edges.
Array-valued offsets must be 1D and match the length of y_data.
import matplotlib.pyplot as plt
import numpy as np

from plotez import ebc, lpc, plot_errorband_relative

x = np.linspace(0, 10, 200)
y = np.cos(x) + x * 0.25
y_err_lower = 0.15
y_err_upper = 0.25

band_cfg = ebc(c="lightcoral", alpha=0.35)
line_cfg = lpc(c="darkred", lw=2, markevery=10, marker="o")

ax = plot_errorband_relative(
    x_data=x,
    y_data=y,
    y_lower=y_err_lower,
    y_upper=y_err_upper,
    x_label="X",
    y_label="Y",
    plot_title="Relative Error Band",
    data_label=r"$[\cos(x) + x + 0.25]^{+0.25}_{-0.15}$",
    band_config=band_cfg,