Data Workflows#
PlotEZ includes helpers for distributions, delimited files, and integration with figures created directly through matplotlib. Complete signatures and parameter details are available in API Reference.
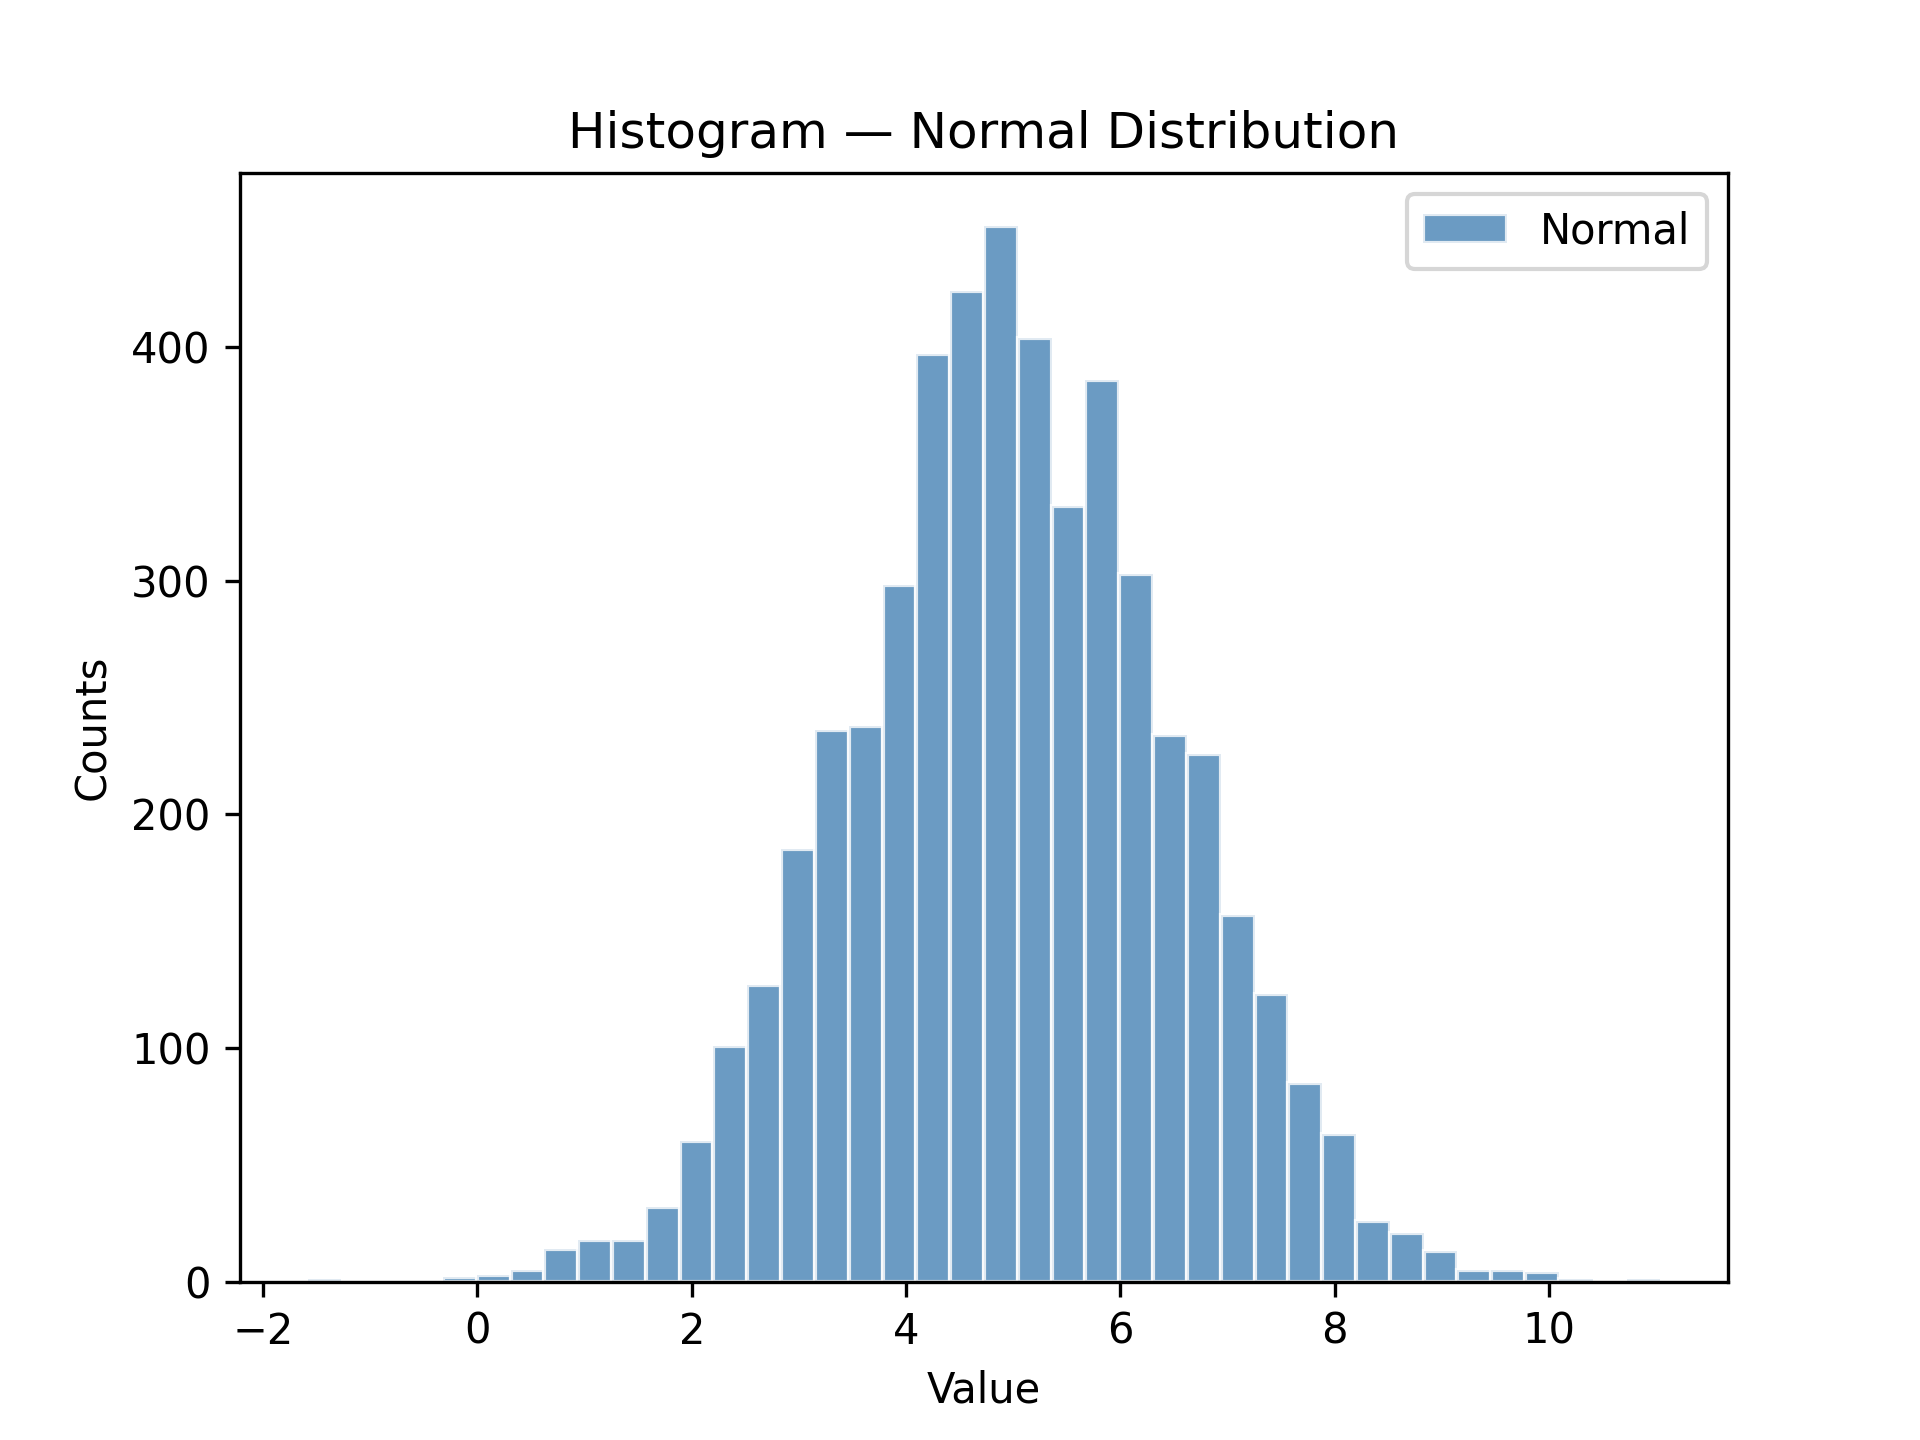
Histograms#
plot_hist wraps ax.hist with the same config-object pattern used throughout plotEZ. hgc
(short for histogram_config) is the companion factory function: pass familiar histogram parameters as keyword
arguments and get a HistogramConfig back.
x_data must be one-dimensional; call plot_hist once per dataset when plotting multiple distributions.
import matplotlib.pyplot as plt
import numpy as np

from plotez import hgc, plot_hist

data = np.genfromtxt("histogram_data.csv", delimiter=",", skip_header=1)
normal_data = data[:, 1]  # second column is 'normal'

h_cfg = hgc(bins=40, color="steelblue", ec="white", alpha=0.8)

ax = plot_hist(
    x_data=normal_data,
    x_label="Value",
    y_label="Counts",
    plot_title="Histogram — Normal Distribution",
    data_label="Normal",
    hist_config=h_cfg,
)
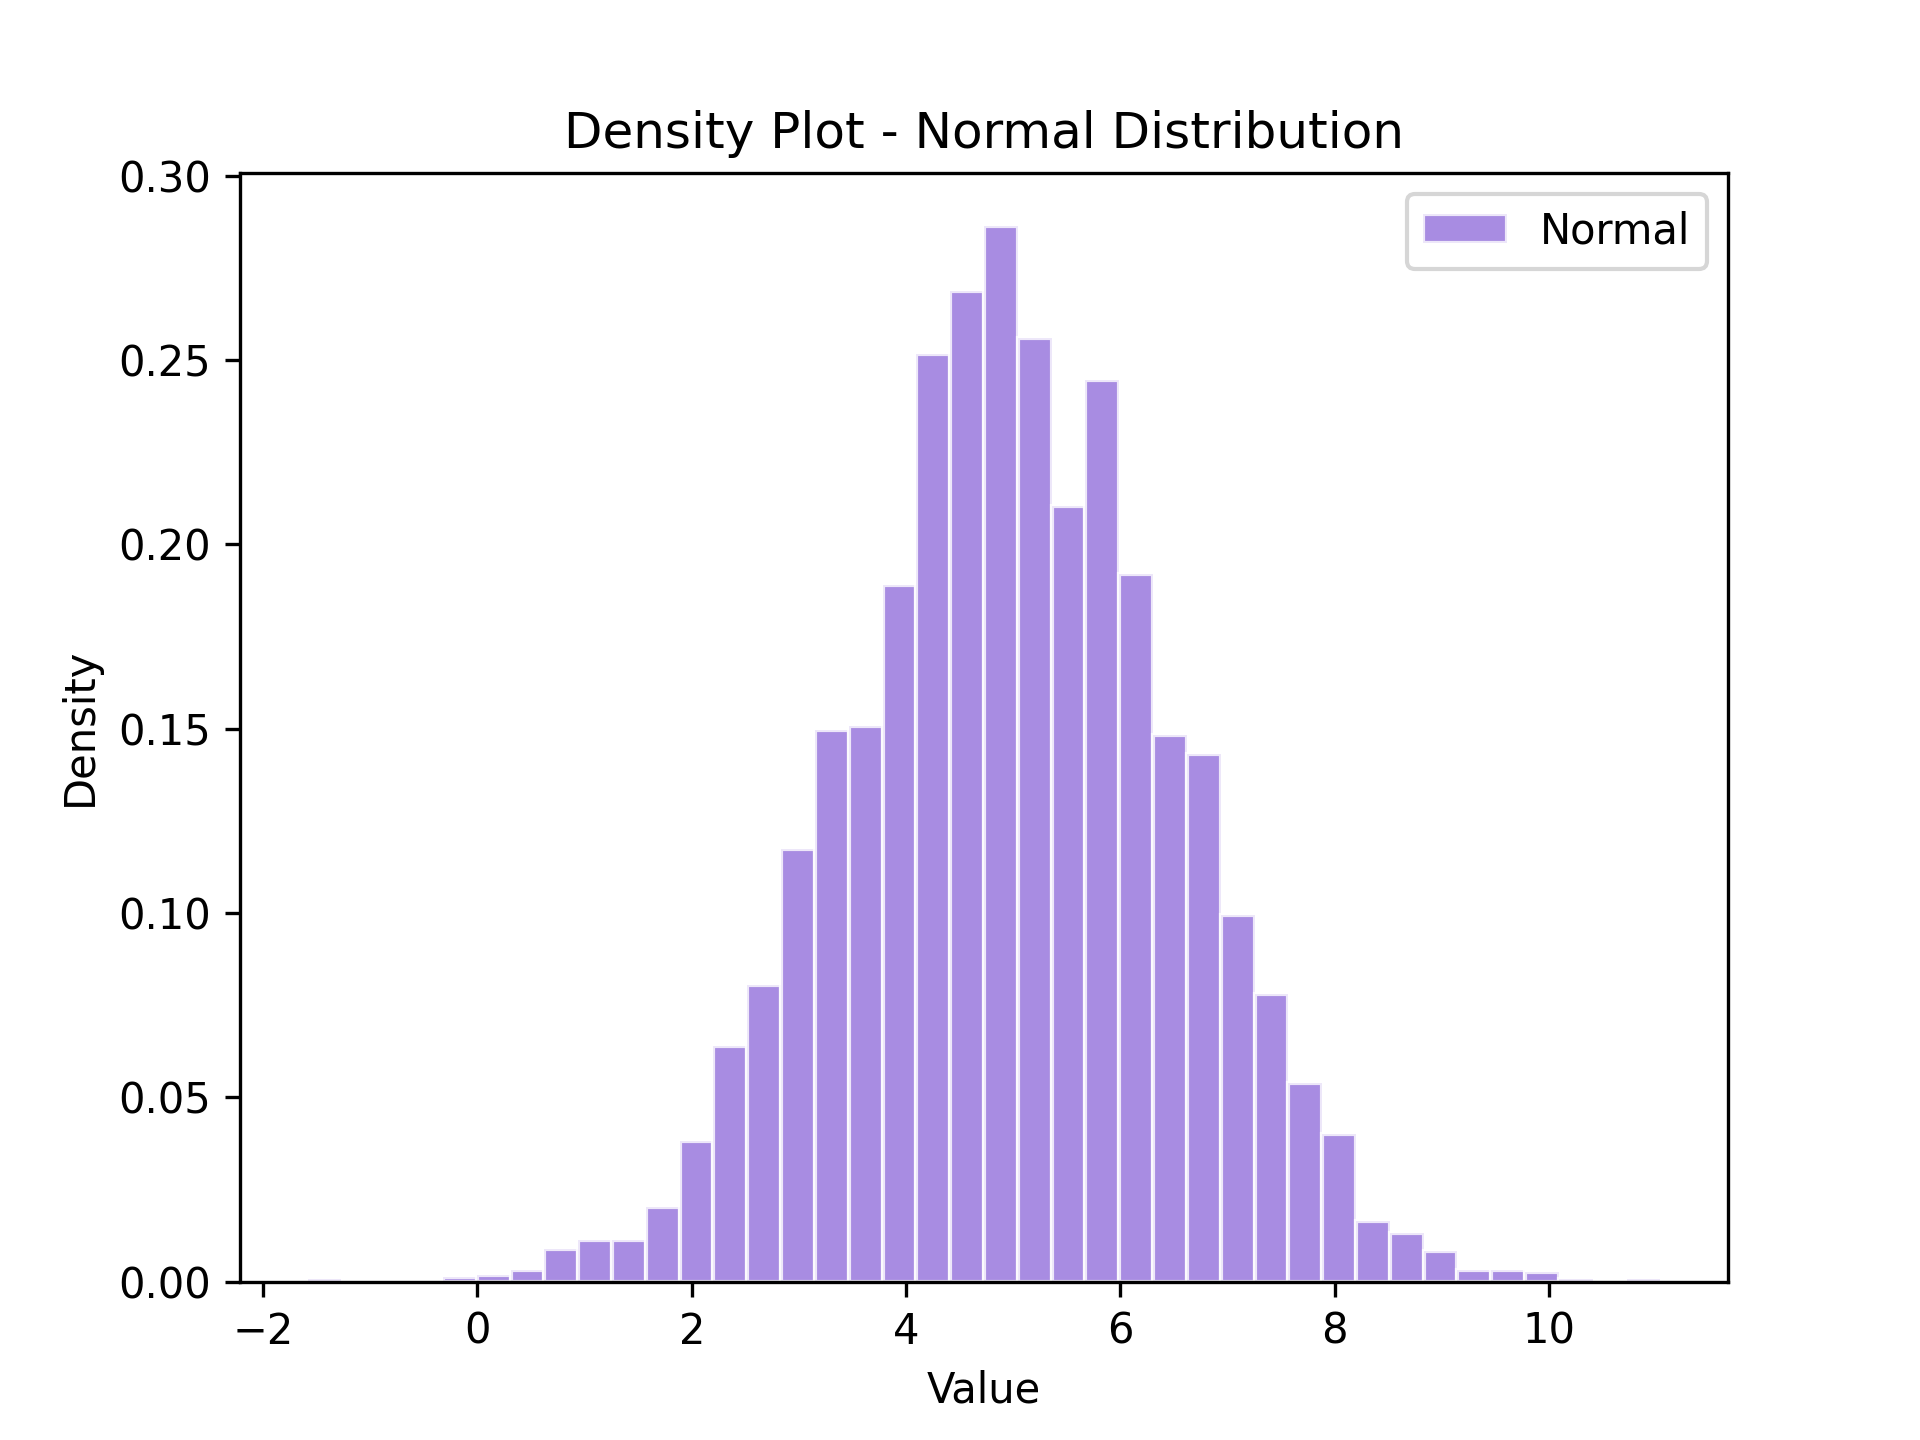
Density Plots#
plot_density is a thin wrapper around plot_hist that automatically sets density=True so the y-axis shows
probability density instead of raw counts.
Pass a HistogramConfig (or hgc) as usual; density is enforced regardless of the config value.
The same 1D input requirement applies.
import matplotlib.pyplot as plt
import numpy as np

from plotez import hgc, plot_density

data = np.genfromtxt("histogram_data.csv", delimiter=",", skip_header=1)
normal_data = data[:, 1]  # second column is 'normal'

h_cfg = hgc(bins=40, color="mediumpurple", ec="white", alpha=0.8)

ax = plot_density(
    x_data=normal_data,
    x_label="Value",
    y_label="Density",
    plot_title="Density Plot - Normal Distribution",
    data_label="Normal",
    hist_config=h_cfg,
)
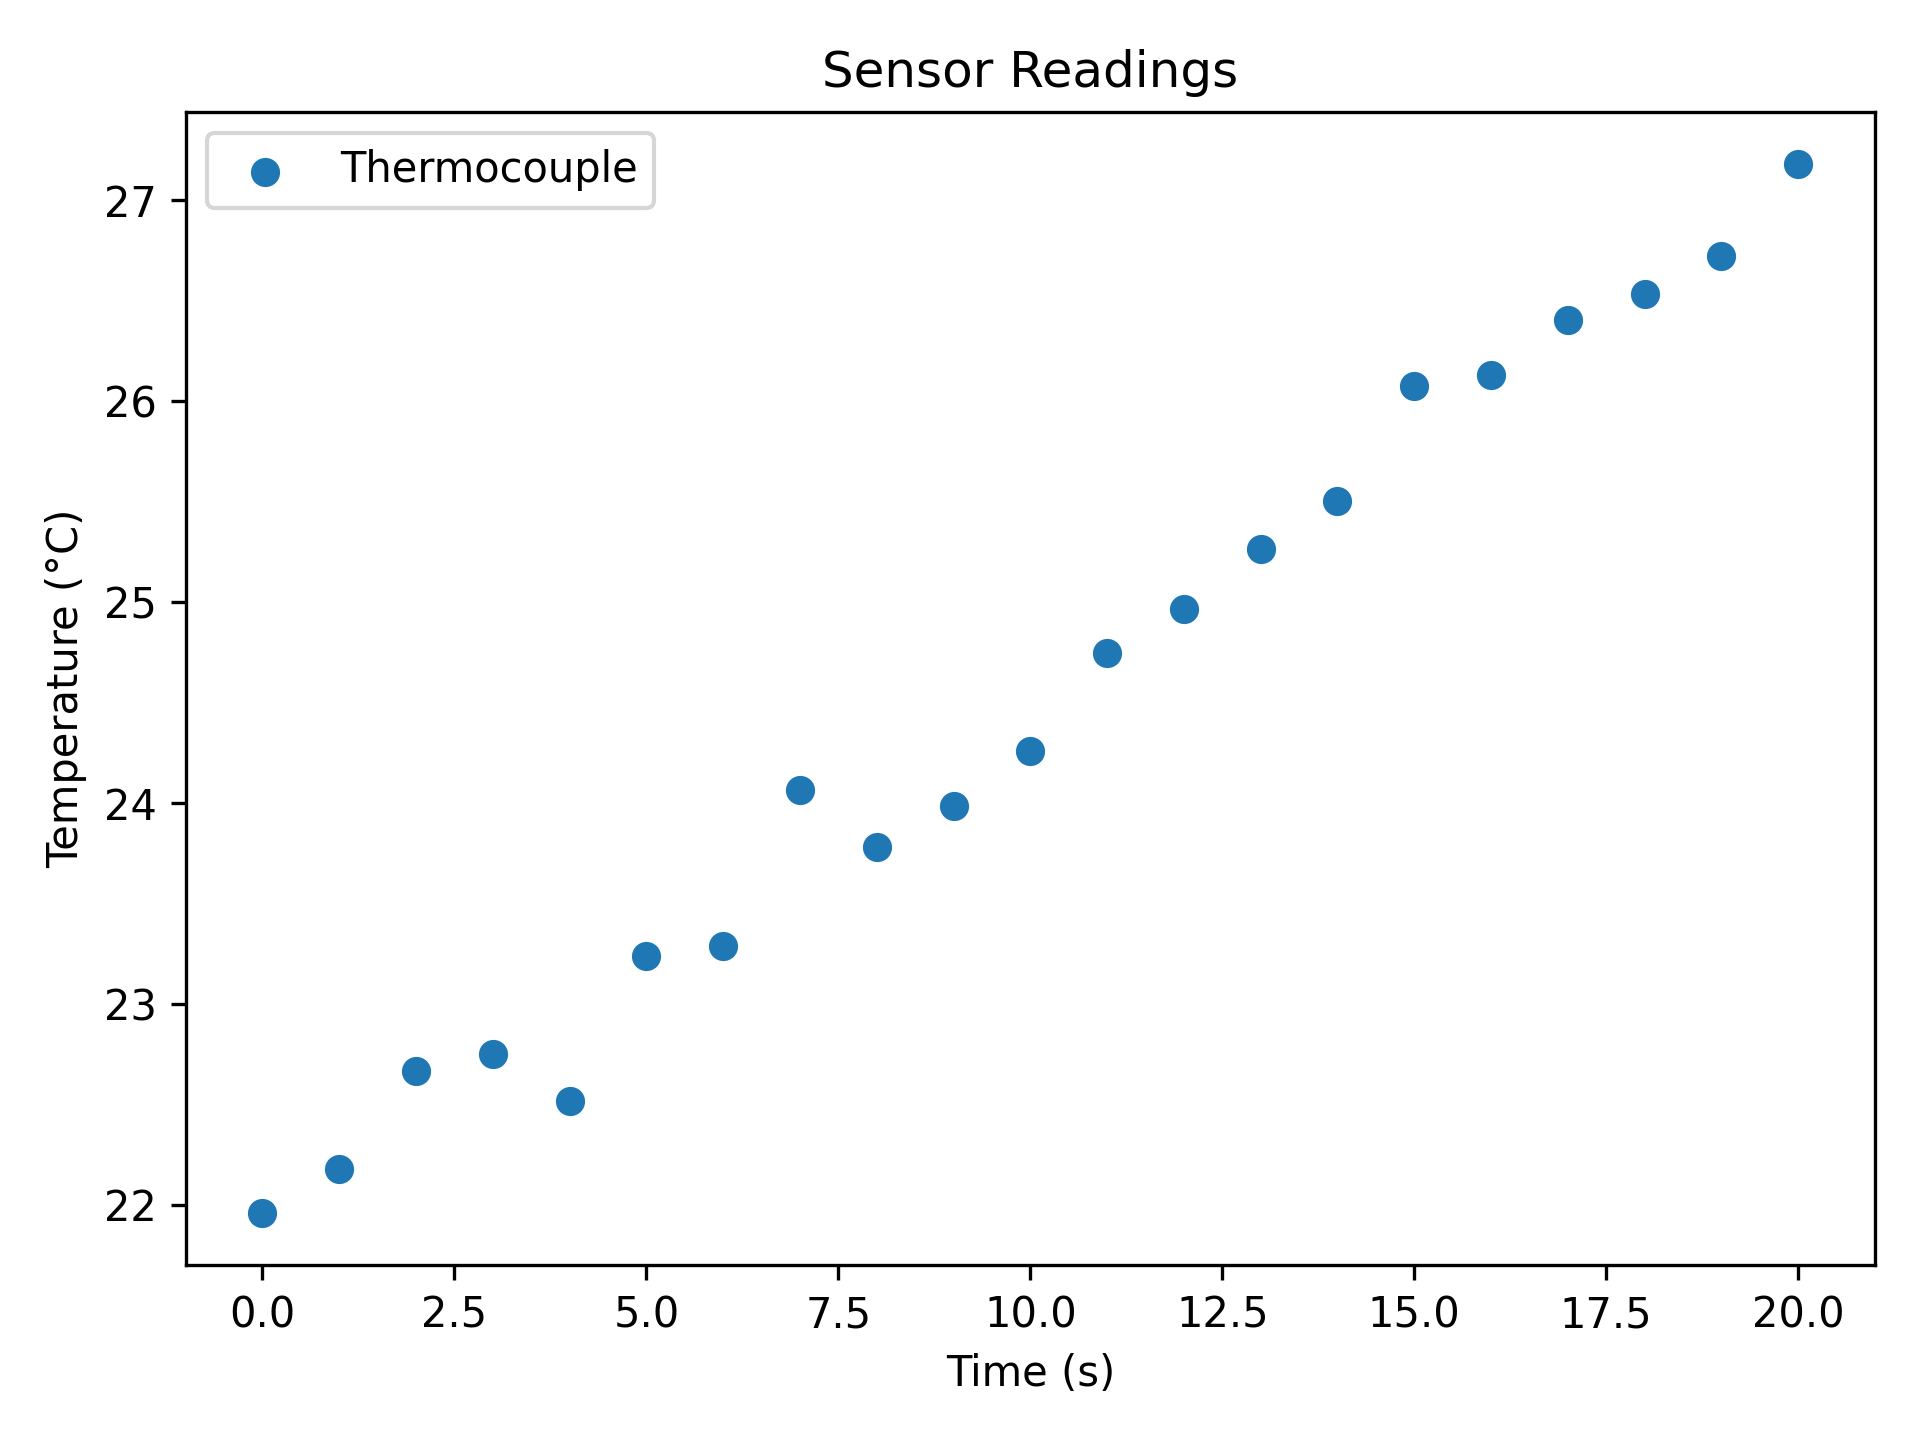
Plotting Two-Column Files#
plot_two_column_file reads any two-column delimited file directly.
The file must contain at least two data rows and exactly two columns (x, y); use skip_header=True to ignore a header row.
Empty and single-row files raise EmptyDataError.
import matplotlib.pyplot as plt

from plotez import plot_two_column_file

plot_two_column_file(
    "sensor_data.csv",
    delimiter=",",
    skip_header=True,
    x_label="Time (s)",
    y_label="Temperature (°C)",
    data_label="Thermocouple",
    plot_title="Sensor Readings",
    is_scatter=True,
)
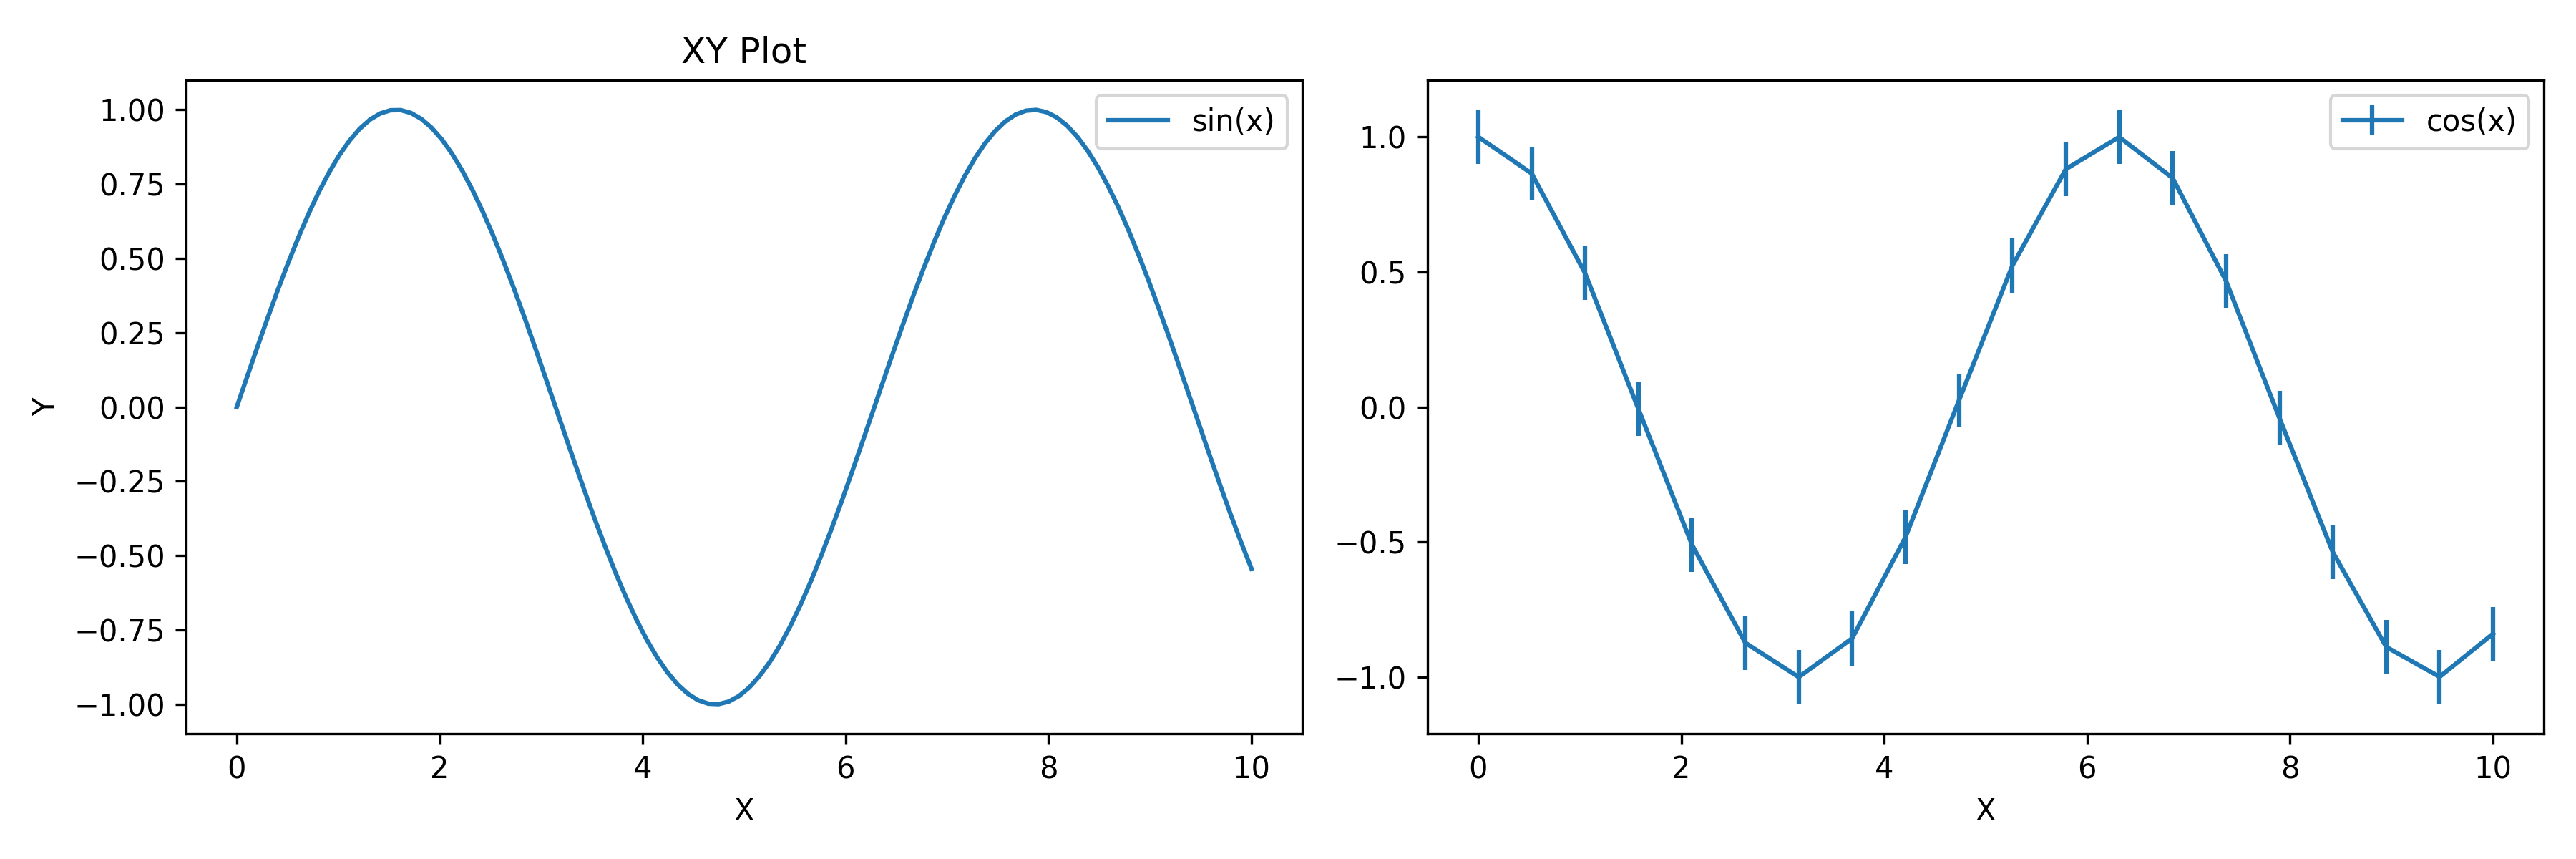
Existing Matplotlib Axes#
All plotez functions accept an axis keyword, so they can draw into an existing matplotlib figure.
Return types are axes-only:
Single-axis functions return
Axes.Dual-axis functions (
plot_with_dual_axes,plot_xyy, andplot_xxy) returntuple[Axes, Axes].Grid functions (
n_plotterandtwo_subplots) return a shaped(n_rows, n_cols)ndarrayofAxes.
The parent Figure is always accessible through ax.get_figure().
import matplotlib.pyplot as plt
import numpy as np

from plotez import plot_errorbar, plot_xy

fig, (ax1, ax2) = plt.subplots(1, 2, figsize=(12, 4))

# Plotez on first subplot
x = np.linspace(0, 10, 100)
y1 = np.sin(x)
plot_xy(x, y1, x_label="X", y_label="Y", data_label="sin(x)", axis=ax1)

# Plotez on second subplot
x2 = np.linspace(0, 10, 20)
y2 = np.cos(x2)
y_err = 0.1
plot_errorbar(x2, y2, y_err=y_err, x_label="X", data_label="cos(x)", axis=ax2)